- 26 August 2019
- Benjamin Anuworakarn
If you’ve been following this series of posts from the beginning you probably know the drill by now. We have a new documentation website, which is packed full of helpful tips and tricks for developers of all knowledge levels. One of our most useful documents, for both new and experienced developers, is our PowerVR Performance Recommendations. This document gives you the knowledge you need to get the most out of your applications running on PowerVR hardware. This post is based on one of these recommendations and is focused on eliminating performance bottlenecks by balancing different GPU workloads.
Removing performance bottlenecks
Performance bottlenecks are the bane of any graphics developer’s existence. They can be incredibly aggravating and very painful if you’re forced to choose between performance and visual quality. But wait – before you rush to do anything drastic, it’s important to remember that bottlenecks can be caused by a particularly heavy workload on an individual processing element of the GPU. By spreading out that workload across more of your GPU’s capabilities, you can potentially eliminate the bottleneck entirely.
However, before you can figure out how to balance the GPU workload, you have to know how it is distributed in the first place. This is where PowerVR’s powerful profiling and analysis tools come in.
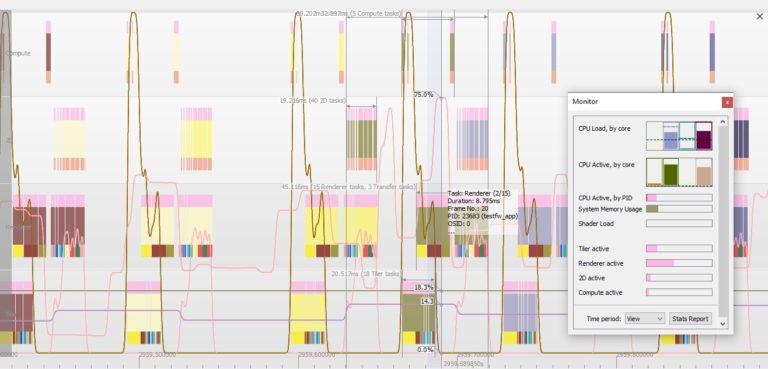
PVRTune collects various counters (performance metrics) about an application to measure the usage of GPU resources. These counters can either be measured in real-time as the application is running or saved to a file so they can be analysed later. The monitor window and graph view make it very easy to visualise this counter data and identify heavy workload in one area of the GPU and under-utilisation in another.

The PVRTune monitor window provides a quick overview of the most important information about GPU workload and the graph view can show how workloads have changed over time
Some of the key counters to watch in PVRTune are:
Renderer Active
This represents the amount of time spent processing and shading pixels. This includes the ISP (see below), texturing, and shader processor units. A high value for this usually means there’s a bottleneck in shader processing or texturing, caused by texture fetches or memory latency. The ISP very rarely causes a bottleneck.
Tiler Active
This measures the amount of time spent vertex processing and performing all projection, culling, and tiling/binning operations. If this value is high, it implies these tiler tasks have been taking a long time. This could possibly be because there are a very large number of polygons which need to be processed, but generally, outside of extreme cases, tiler tasks don’t tend to cause bottlenecks. It may be worth reducing the number of polygons that are submitted to the GPU if this counter is really high (> 80%).
Shader processing load (ALU)
This counter shows the average workload of the shader processor when it is processing vertices, fragments, and compute kernels. For a bit more information, you can take a look at the counters which measure these three specific loads, Processing load: Vertex, Processing load: Pixel, and Processing load: Compute. These could help you figure out which shader stage is causing the bottleneck.
Texturing Load
The Texturing Load measures the average workload of the texturing units. A value of above around 50% means a significant amount of time was spent fetching texture data from the system memory or performing linear interpolation filtering operations.
To pin down the exact nature of this bottleneck check out this counter:
- Texture Overload – if this is high it probably means that the shader processing units are submitting requests faster than the texturing unit can process them.
ISP (Image Synthesis Processor) pixel load
This counter represents the amount of time that the ISP pixel-processing is busy. The Image Synthesis Processor (ISP) fetches primitive data and performs Hidden Surface Removal (HSR), along with depth and stencil tests. If this counter seems to be too high, it likely means that a large number of non-visible pixels are being processed. This might be because there are lots of pixels which are hidden behind opaque objects, or a process may only be updating the depth or stencil buffer rather than the colour buffer.
Spreading the Load
Once you’ve identified which areas are causing a bottleneck, it’s simply a matter of choosing the best optimisation strategy to spread the workload.
Here are a few suggestions for resolving common bottlenecks:
- ALU utilisation can be traded for texturing load if some of the equations are pre-calculated, and the result is stored in a lookup table (LUT). An example of this approach can be seen in our physically-based rendering demo, ImageBasedLighting, which stores part of a complex bidirectional reflectance distribution function (BRDF) in a texture look-up texture.
- Alpha testing and noise functions are usually used in combination to achieve a level-of-detail transition effect. This is often quite ALU-heavy. ALU can be traded for ISP in this scenario by running a stencil pre-pass.
- In some very rare cases, where the required texture is fairly simple, texturing load can be traded for ALU utilisation by replacing texture fetches with procedural texture functions.
You can also read more about the features of PVRTune and the more powerful PVRTune Complete (NDA only) on our website.
Or download it to see for yourself!
And finally…
For more of these suggestions and other performance recommendations for PowerVR please visit our brand-new documentation website. The website is regularly updated with new documents and features and includes “Getting Started” tutorials for Vulkan® and OpenGL® ES, optimisations and recommendations for PowerVR hardware, and guides to new graphics techniques.
Please do feel free to leave feedback through our forum.


