- 21 March 2018
- Imagination Technologies
Some of our PowerVR Developer Technology team are living it up in San Francisco this week at the Game Developer Conference 2018 on our Imagination Technologies booth #102. If you’re lucky enough to be at GDC, the fact you’re taking the time to read this blog post suggests you may well be interested in what we’re showing there – which means you really should take the time to pop along to see our boys in purple, who will be very happy to give you a demo. And if you’re not going along, then it’s even more important you read this to find out about what you’re missing!
So, what’s the big news? Well, we’re delighted to finally announce our two brand new and groundbreaking developments from our PowerVR Developer Technology team as part of our 2018 Release 1:
- PVRStudio – An entirely new tool for 2018. It’s a fully-featured IDE that, in a world first on mobile/embedded devices, enables you to debug the GPU (PowerVR in this case). It also lets you simultaneously debug both CPU and GPU together in the same session.
- PVRTune Complete – This new iteration of our highly-regarded performance analysis tool brings some pretty major upgrades. With another world first, we’re exposing more in-depth driver and hardware information than any other mobile GPU vendor to date.
Keep on reading to find out more!
PVRStudio
It’s always exciting for a team to announce a new tool, but PVRStudio is so much more than that. Not only is it a powerful and fully-featured IDE tailored for PowerVR development as you would expect, but GPU debugging on a mobile/embedded platform has never been done before.
Add into that the simultaneous and seamless debugging of both the CPU and GPU, which has also never been done before on mobile/embedded platforms, and you can see why we’re so keen to shout about it.
Developers will be able to debug programs – such as OpenGL ES™ shaders and OpenCL™ kernels that are executing on the GPU hardware – specifically the Unified Shading Core (USC). This is all done in much the same way as we’ve all been doing with CPU debugging for decades. This new, fully-flexible IDE will allow for much finer granularity in GPU debugging and optimisation than what’s been possible before, by giving the developer direct access to the PowerVR USC.
A very modern, highly robust IDE and debugger
PVRStudio is based upon the very popular, lightweight Qt Creator, which gives you the following features:
- Full support for the usual breakpoints and code stepping that you would expect from an IDE
- Easy viewing of the memory layout of graphics shaders and compute kernels
- The ability to step into instances of shader executions at the hardware level and inspect memory and GPU registers (for the particular instance being debugged) on the PowerVR GPU hardware
PVRStudio uses a fork of GDB called PVR-GDB. This means PVRStudio is also able to debug any processor architecture that is natively supported by the GDB implementation. We have also added the ability to debug PowerVR architecture to GDB.
All PowerVR tools are based upon the Qt framework, which results in a cohesive UI experience for all PowerVR developers.
PowerVR Studio is a fully-featured IDE that enables developers to debug the PowerVR GPU and CPU together in the same session.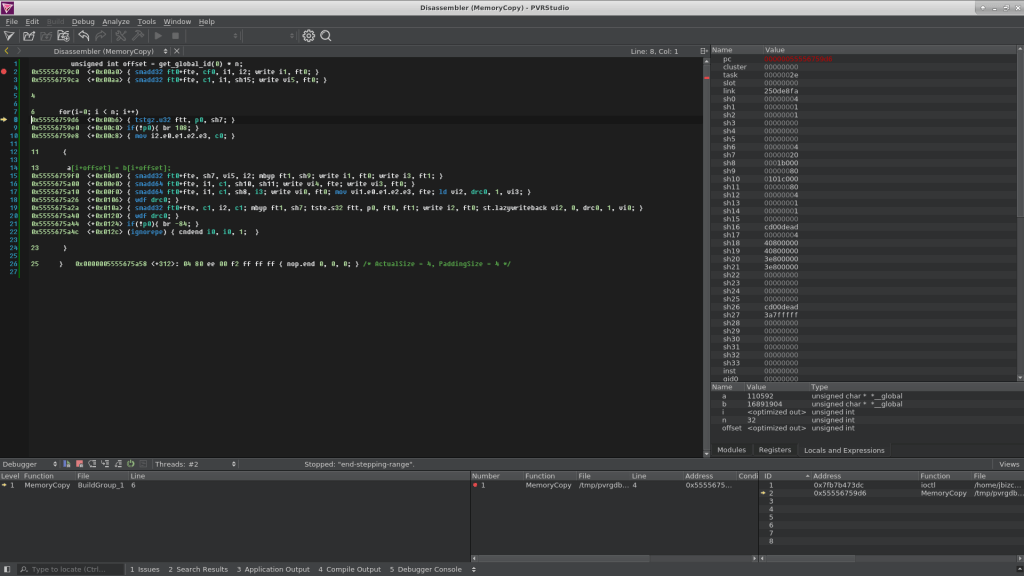 PowerVR Studio is a fully-featured IDE that enables developers to debug the PowerVR GPU and CPU together in the same session.
Faster development, and fully customisable – with no dependencies
PVRStudio uses CMake as its main project management process, as well as supporting Makefiles. It supports out-of-the-box deployment for both Android and Linux.
Developers are able to add custom steps to build and deployment processes as required. There is also support for third-party plug-ins to enhance the IDE.
In a nutshell
PVRStudio provides an end-to-end solution for your development, debugging and deployment on PowerVR devices. It will be available in April for Windows and Linux and will be under NDA at that time. You will need an Android or Linux image from us (currently for the Acer Chromebook R13 hardware), which we will keep regularly updated.
PVRTune Complete
Our PowerVR GPU performance analysis tool PVRTune has always provided developers with real-time visualisation of various performance metrics being emitted by the GPU, for fast and efficient profiling sessions fully tailored to PowerVR architectures.
Driver level software counters and hardware registers are used to provide real-time data on the performance of an application running on a PowerVR graphics core. This fine-grain performance information can be used to easily identify bottlenecks and to fully understand the dynamics of their applications on mobile and embedded devices. This enables developers to achieve optimal performance with the lowest possible power consumption.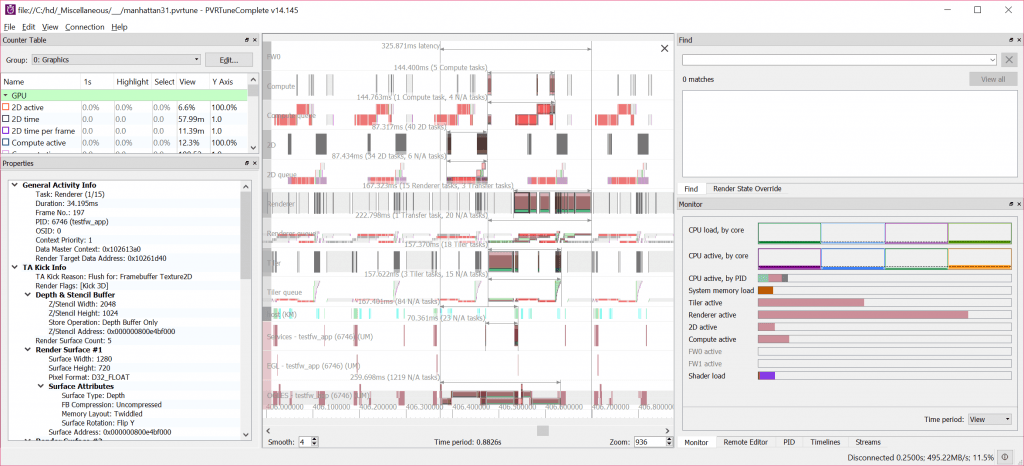
The new iteration of our highly-regarded performance analysis tool brings some pretty major upgrades
So what’s new with PVRTune Complete?
For this next release (PVRTune Complete 2018 R1) developers will be able to get even lower level information than ever before from the underlying hardware and driver. One of these methods is through “API Awareness“.
How does API Awareness work?
PVRTune Complete is able to retrieve and present events that have been generated by the client driver of the applications programming interface (API) such as OpenGL ES and the EGL™ native platform interface. This lets developers view application-level API calls (e.g. glDraw) in the PVRTune GUI and trace a piece of work from the application level through the PowerVR driver and onto the hardware for execution.
In this way, developers can see how work that was submitted at the application level directly affects the behaviour and performance of both the driver and hardware. PVRTune Complete can also provide other information from the client driver such as surface format, size and shader details. It currently supports OpenGL ES / EGL APIs, with Vulkan® support to follow.
Has anything else changed?
Yes! To make all that new low-level information even easier to understand, we’ve given the UI a shiny makeover too. Navigation is now more intuitive than ever, and the clarity of data presentation has been much improved.
I want to know even more about PVRTune Complete…
PVRTune is split over two applications:
- PVRTune GUI is a multi-platform client that runs on the developer machine. It reads, formats and presents the client data stream sent by the server
- PVRPerfServer is a lightweight application that runs on various target platforms. It connects to our graphics driver and forwards the data to the GUI (or to a file) that the driver is emitting
The “client data stream” refers to the timing data generated and emitted by the client part of our graphics driver such as the OpenGL ES and EGL modules. Only certain important API calls made by the application are tracked, such as glDraw* and others.
PVRTune is the only tool out there that will interface with our driver and hardware in order to read timing data.
We are retrieving and presenting the following, generated by the OpenGL ES and EGL client driver:
- API Events
- Useful associated state information such as:
- render targets – including pixel format, dimensions, depth/stencil load/store operations, compression and so on
- bound shaders – currently GLSL source code, but later this may be more
- texture info
- .. and more
This means that developers are able to view application level API calls such as glDraw* in the PVRTune GUI. They can “trace” that piece of work submitted by their app from the application level right through our driver (services, firmware etc.) and onto the hardware for execution. As a result, developers can now see how work submitted at the application level directly affects the driver and hardware. This is the first time a GPU vendor is exposing so much low-level driver and hardware information.
Is there anything else?
We’re not quite finished yet! Synchronisation objects are used by the driver to ensure that operations queued by the driver are executed by the GPU in the correct order. Operations can be blocked by synchronisation objects until a previous operation completes and frees a resource, such as a render target.
PVRTune Complete now captures the synchronisation objects emitted by our driver and presents them to the user in new timelines called “queues”. Each hardware core such as the tiler, renderer, and compute will have an associated queue if synchronisation data is available.
The timeline queues enable users to see when work is queued by the driver. The operations can be traced from the client drivers to the hardware queue. In most cases, there will be a delay between the driver scheduling the work, and the hardware executing it. This information is useful to developers because it may help you to diagnose pipeline bubbles in your application’s workload. An example of this could be where work has been queued for a long time but was unable to execute due to a dependency on a resource, and possibly leaving the hardware idle.
And what about the original PVRTune?
As PVRTune Complete will only be available under an NDA, “PVRTune Developer” is still being developed in tandem with PVRTune Complete and is available for download as usual. PVRTune Developer has many of the same features as PVRTune Complete, but with reduced functionality, particularly relating to the client stream and synchronisation objects.
“PVRTune Complete” will be available in April under NDA for Linux, Windows and OSX.
I’m interested in these tools!
As you should be. If you’re not able to attend our booth at GDC this year, then please drop us an email at devtech@imgtec.com with your questions. You can also follow us on Twitter for updates at @ImaginationTech and also on LinkedIn, Facebook.


